Graph Editor
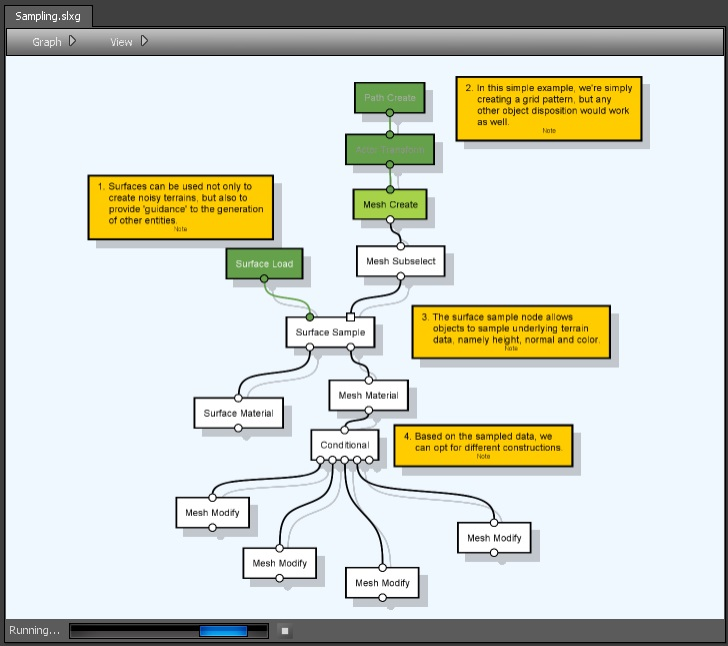
The graph editor is one of the available file editors and one of Sceelix’s core interface element. It is displayed inside the Document Area and handles files with the .slxg extension.
Controls
This is the control used to view and edit graphs, which appears in the Document Window:
- Left-Mouse click: Selection of nodes, edges, ports and presentation of graph properties.
- Right-Mouse click: Context menu for graph and selection.
- Middle-Mouse press or Left + Shift while moving mouse: Camera panning.
- Mouse Scroll Wheel: Camera zoom in and out.
- F: zoom on a node selection or on the full graph (if nothing is selected).
- Alt+Left Mouse click: When pressed on edges and ports, toggles between states (enabled, disabled, etc.)
Settings
You can change the graph editor settings through the graph editor’s menu -> View->Settings. These could also be accessed through the application top-most menu->Application->Settings and looking under Editors->Graph.
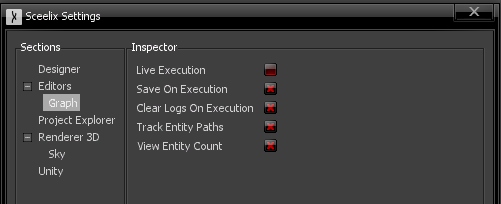
For now, the following settings are available:
- Live Execution: If enabled, every change made to a graph being edited will force a graph re-execution. Note that only changes that might contribute to a change in the result will be considered (for instance, changing the label of a node will not trigger an execution). While this option is useful to quickly see the results of the graph being edited, for longer and more work-intensive graphs the process may not be desired, especially if the graph execution becomes more CPU-intensive.
- Save on Execution: If enabled, the graph will be saved every time, before it is executed. Enabled by default.
- Clear Logs on Execution: If enabled, all entries in the log window will be cleared when the graph is executed.
- Track Entity Paths: If enabled, tracking information about the nodes, edges and ports that an entity has gone through will be registered. This will enable coloring of the nodes that led to creation of a given entity, once it is selected in the Data Explorer or any other viewer. This is very useful to understand the nodes that contributed to the creation of an entity, when it is selected, but can carry a significant performance overhead for more complex graphs.
- View Entity Count: If enabled, it will show, at each port, how many entities have come in (for input ports) or come out (for output ports) in the last graph execution.